One of my favorite features of Hydrology Studio’s detention pond design is its charting abilities. But there’s one chart that reminds me of a smart phone. It does everything. In fact, so much that it can be overwhelming. It’s the Stage-Discharge chart for a multistage discharge structure configured like this:
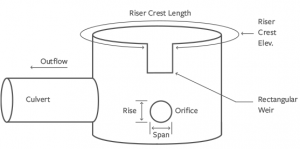
This structure contains a culvert at the downstream end. There’s an orifice and a rectangular weir housed in a riser weir all connected to the upstream side of the culvert. It’s works like this: A runoff hydrograph begins to fill up the detention pond. As the water (stage) inside of the pond begins to rise, flow runs through the orifice first, and then the rectangular weir. All of the water from each of these devices then flows through the culvert.
When the Culvert is in Control
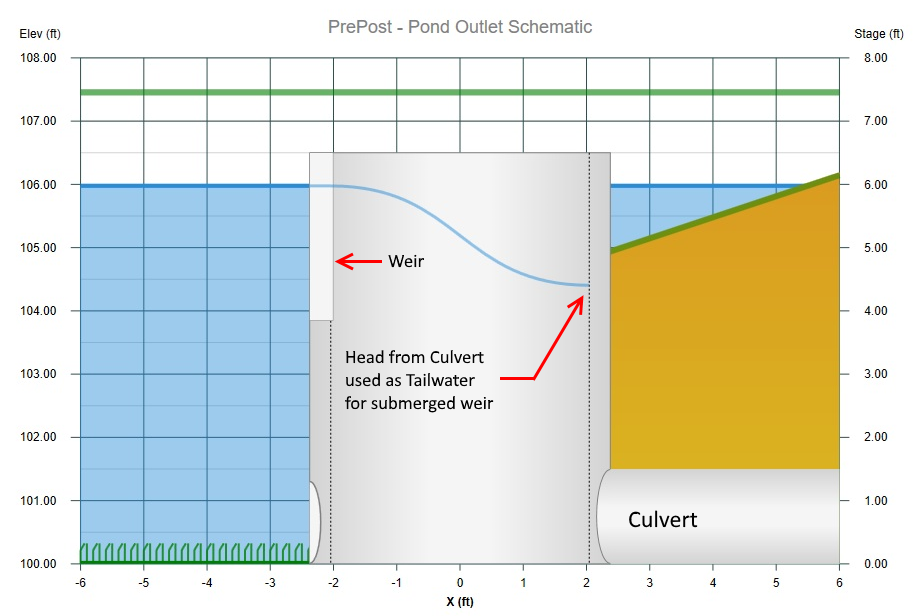
But sooner or later the culvert reaches its flow capacity and starts producing a headwater. This headwater begins to fill up the riser which in turn reduces the positive head against the orifice and weir. As the positive head diminishes, so does the flow contributions from these two devices. Eventually the riser becomes completely submerged. The orifice and rectangular weir are disabled with no head, thus no flow. The culvert at that point controls the total outflow.
This is what that scenario looks like in chart form:
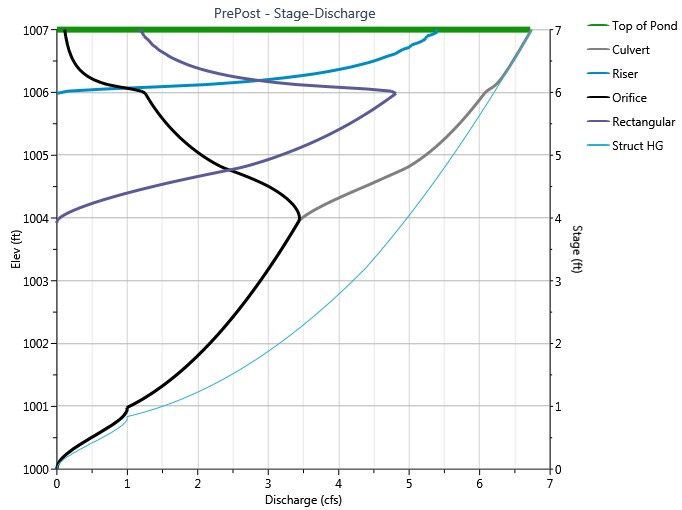
It’s a lot to absorb at first but basically, as the legend indicates, most of those lines indicate the discharge for a particular structure at any given elevation in the pond. It simply tells us how the structure would perform at the various water levels. In this case from stage zero feet to seven feet. For example, the orifice is discharging 3.5 cfs at stage 4 ft. Notice the culvert indicates the same 3.5 cfs at 4 ft. That’s because it’s discharging exactly what was given to it by the orifice.
But there’s one line of particular interest, the Structure HG. This is the thinner blue line and it indicates the elevation of the water surface inside of the riser at any given total discharge. In other words, it’s the head produced by the culvert. This head acts like a tail water for the other Riser-contained devices like the orifice and rectangular weir.
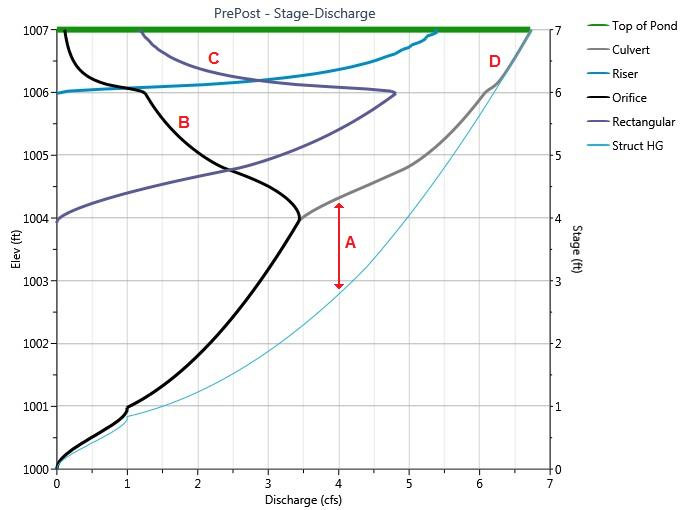
The vertical distance (A) between the Structure HG and the Culvert is the difference between the water surface in the Riser and the water surface of the pond. As you follow the Structure HG line upwards you’ll notice as distance (A) decreases, the flows from the Orifice (B) and Rectangular Weir (C) tail back. Point D on the chart is where the Riser is completely underwater. The Culvert controls what leaves the pond.
Want to Learn More?
See these charts in action. Watch my video tutorial, Detention Pond Design in 3 Easy Steps.